Forex Market Trends
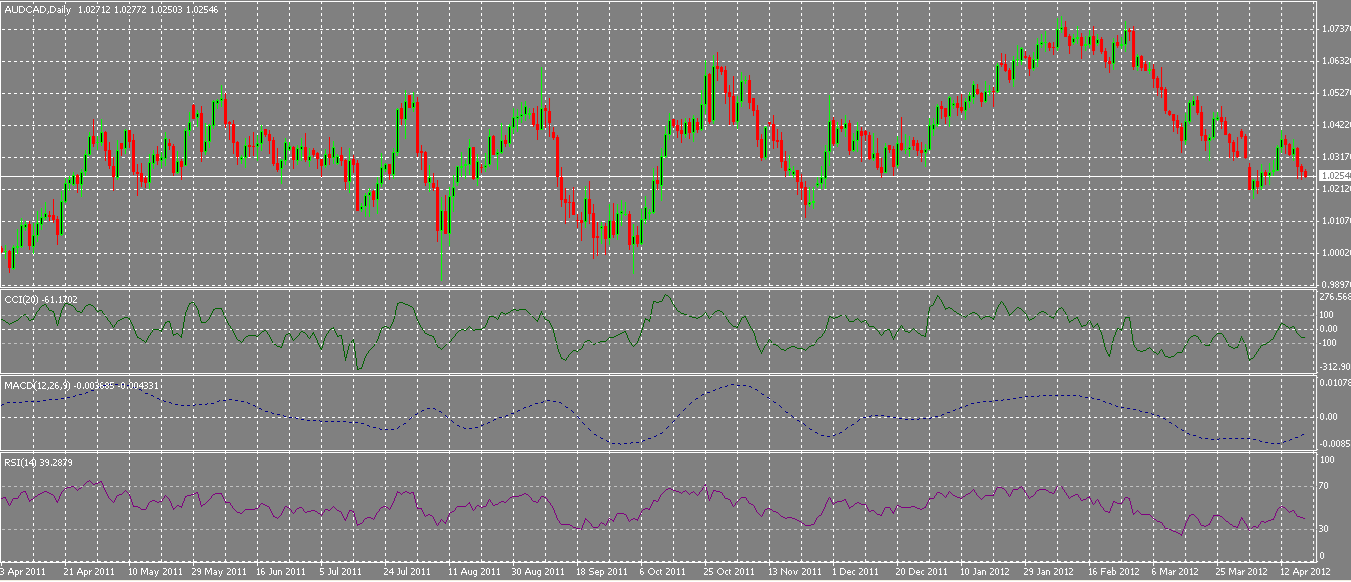
Technical analysis in CFD and Forex trading refers to the study of historical data and charts in order for traders to make better educated trades. Please note, past performance is not always an indicator of future performances.
There are 3 basic types of trends:
- Short term
- Intermediate term
- Long term
First, one must decide on the type of trader/investor that he/she is. You must decide whether or not you hold positions for a long time or buy and sell fast. That decision will determine which trading charts you should be using. Day traders or those who invest in and out of positions fast will use daily and intraday charts more than investors who buy and hold for long periods of times.
Practice your Technical Analysis on a Demo Account or open a Real Account if you are ready to trade.
Support and Resistance Levels
A support level could be the previous low. The resistance level could be the previous day’s high point, or better known as a peak. After a resistance level has been broken, it will usually become a support level should the instrument you are trading decline again. When the instrument moves down and breaks the support, then this becomes the new resistance. Looking at it the other way if the instrument moves higher through the resistance level, this becomes the new support.

Retracements
Retracements are movements back from a main trend – corrections – and are usually measured as a percentage of the last main trend movement. During any given day (open to markets), the instrument you are watching or investing in, will usually retrace the previous day’s trades, regardless whether they are up or down. The most retracement size is fifty percent of the previous main movement. We also use the one third, 38% and 2/3 levels.

Trend Lines
The easiest way to begin your analysis is by learning and applying trend lines. First, draw a straight line that joins two high or low points on your chart. To show a trend line that is increasing, connect two lows in a row and for a trend line that is decreasing, connect two straight peaks.
You will note that usually, the market (price) will pull back towards a trend line before resuming a trend. When the price breaks a trend line, this is the end of a trend. The longer a trend line the more it has been tested and the more important it is. Note that a trend line becomes valid after the market touches it 3 times.

Moving Averages
When you are looking for buy and sell signals, one looks at moving averages. These averages will tell you if an existing trend is still in play. Beware: these do not predict trend changes. Traders usually use two moving averages. Movements above and below the 20 and 40 day averages are very popular. 5 and 20 day averages are very popular for those who trade quickly.

Oscillators
In order to identify overbought or oversold conditions in markets, oscillators are commonly used. These often warn a trader that a market has either risen or the market has fallen too far and a change is imminent.
The Relative Strength Index or RSI and the Stochastics are the most popular oscillators a trader will use. Now, these scales are from 0 to 100. The RSI: a reading over 70 means an asset is overbought. If the scale is below 30, it is oversold. For Stochastics overbought is 80 and oversold is 20.


