

ROC Trading Strategies
Technical Analysis Indicators & Strategies • 7 min
The percentage of our retail client accounts that were profitable in the last, most recent, four quarters was: | Q1-2026 : 30% | Q4-2025: 29% | Q3-2025: 40% | Q2-2025: 30%. Contracts for Difference (CFDs) are complex instruments with a high risk of losing money rapidly due to leverage and may not be suitable for all investors. You should not trade with money you cannot afford to lose. These percentages are for illustrative purposes only and do not indicate future performance.
If the forex market is a jungle, then chart patterns are the ultimate trails that lead investors to trading opportunities. When trading financial assets in the forex market, profits (or losses) are made out of price movements. Price changes are usually represented using candlesticks, and after a series of time periods, candlestick patterns form on a trading chart, telling the price action story of the underlying asset. Chart patterns are powerful tools for performing technical analysis because they represent raw price action and help traders to feel the mood and sentiment of the market. They essentially allow traders to ride the market wave, and when well understood and interpreted, they can help pick out lucrative trading opportunities with minimal risk exposure.
Chart patterns are classified according to the signals or directional cues that they provide to traders. Here are the 3 types of chart patterns:
Continuation chart patterns form during an on-going trend and they signal that the dominant trend will continue. Continuation chart patterns usually occur during price consolidation periods and offer great opportunities for traders to open positions in the direction of the dominant trend. The most common continuation chart patterns include directional wedges, flags and pennants. These patterns build up in a retracement manner and a breakout in the direction of the main trend confirms that the temporary pullback is now over.
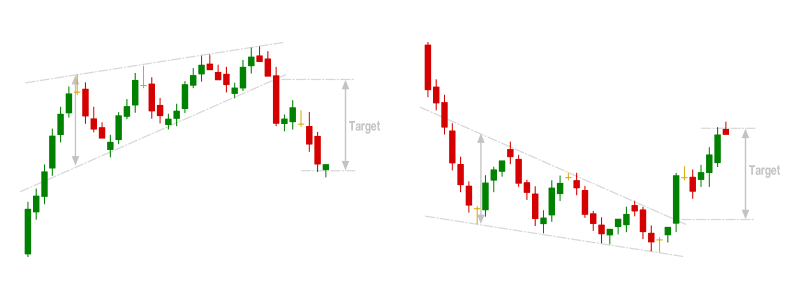
Directional wedges can deliver reversal signals. Falling wedges form at the bottom of a downtrend whereas rising wedges form at the top of an uptrend. Directional wedges inform about the struggle between bulls and bears when the market is consolidating. For instance, a rising wedge in a downtrend is an indication that buyers are actively pushing the price higher, but they are forming higher lows faster than they are forming higher highs. This is a signal of buyer exhaustion and prices are likely to break lower to resume the downtrend.
Pennants usually signal a small pause in a strong trend. They form in the shape of triangles, but they are very brief, with the resulting move duplicating the movement that preceded the formation of the pennant. In an uptrend, a bullish pennant will form when a small period of consolidation is followed by a strong desire by bulls to drive prices higher. It will be a signal that bulls are charged up for another strong push higher.
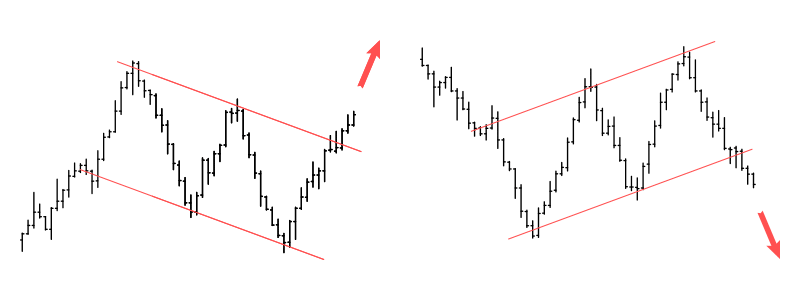
Flags form when prices consolidate after sharp trending moves. The preceding sharp trending move is known as a flagpole. In an uptrend, a flag pattern will form when prices consolidate by forming lower highs and lower lows to signal a period of profit-taking. A break outside the upper falling trendline will be a signal that bulls are ready to drive prices higher for the next phase.
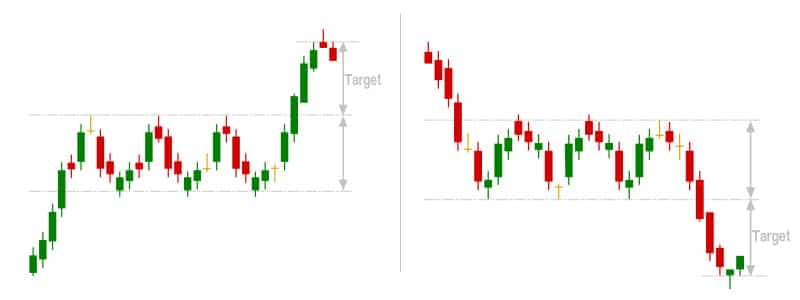
A rectangle chart pattern is a continuation pattern that forms when the price is bound by parallel support and resistance levels during a strong trend. The pattern denotes price consolidation, with drivers of the dominant trend needing to literally ‘catch a breath’ before pushing further. The pattern forms in both bullish and bearish trends. When a rectangle forms, traders look to place a trade in the direction of the dominant trend when the price breaks out of the range. When a breakout occurs, it is expected that the price will make a movement of at least the same size as the range. This means that if a rectangle chart pattern forms in an uptrend, traders will look to place buy orders after the horizontal resistance is breached. The target price movement will be the size of the distance between the support and resistance lines. Similarly, if a rectangle chart pattern forms in a downtrend, traders will look to place sell orders after the horizontal support is breached.
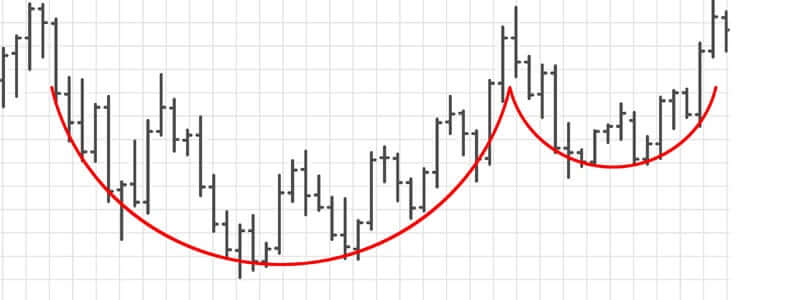
The cup and handle chart pattern is a bullish continuation pattern that forms after a preceding uptrend to signal that upward momentum will continue after a period of price consolidation. The pattern consists of two parts: the cup and the handle. The cup forms after prices first drift lower, then turn higher in a ‘U’ shape, similar to a ‘bowl’ or ‘rounding bottom’. After the ‘cup’ is completed, prices consolidate sideways in the shape of a rectangle, flag, or pennant to form the handle. The handle is a period of price consolidation after the cup, and ideally, it should not drop below the cup (which handle does?). When the cup and handle pattern forms, traders can look to place buy orders on either a breakout from the handle or a breakout off the highs of the cup. The first profit target is equal to the height of the cup formation, while stops can be placed below the handle.
Gartley is a popular harmonic chart pattern that delivers continuation signals based on Fibonacci levels. The pattern forms when a trend is correcting in an ‘M’ shape for bullish trends or a ‘W’ shape for bearish trends. Gartley patterns are preceded by either a significant high or low (X), followed by the ABCD correction pattern. Here are the characteristics of a Gartley pattern:
At point D, traders will look to enter trades in the direction of the main trend (the direction of XA). The initial price targets are C and A, with the final target being 161.8% of A. A stop can be placed below X for the entire trade. Continuation chart patterns offer low risk, optimal price entry points for traders to join the direction of the dominant trend.
Reversal chart patterns form when a dominant trend is about to change course. The chart patterns signal that a prevailing trend’s momentum has faded, and the market is about to reverse. If there is an uptrend, a reversal chart pattern signals that the market is about to turn lower; similarly, a reversal chart pattern in a downtrend signal that the market is about to turn higher. The most common reversal chart patterns include straight and reverse head and shoulders, double tops and double bottoms, falling and rising wedges, as well as triple tops and triple bottoms. Reversal chart patterns happen after extended trending periods and signal price exhaustion and loss of momentum.
A straight head and shoulders pattern forms in an uptrend when the price makes three highs: the first and the third highs are almost similar in height (shoulders), while the second high is higher (head). A neckline is drawn to connect the lowest points of the troughs formed by the formation. The distance between the neckline and the ‘head’ serves as the target price when the price breaks below the neckline. A reverse head and shoulders forms in a downtrend, with the second low being lower than the first and third lows. The target price will be the distance between the neckline and the head when the price breaks above the neckline.
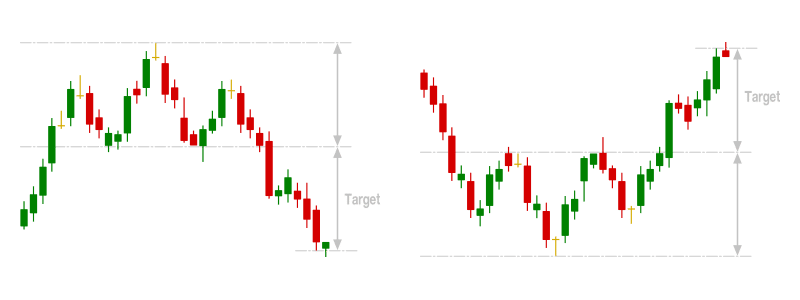
Double tops and double bottoms form after the price makes two peaks or valleys after a strong trending move. They signal price exhaustion and a desire by the market to reverse the current trend. Price targets, when trading double tops and bottoms, are equal to the same height as the formation.
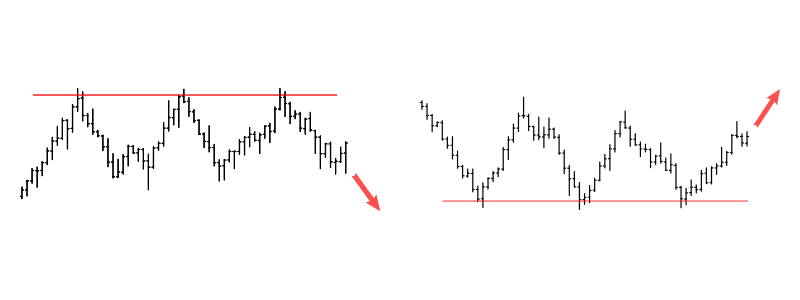
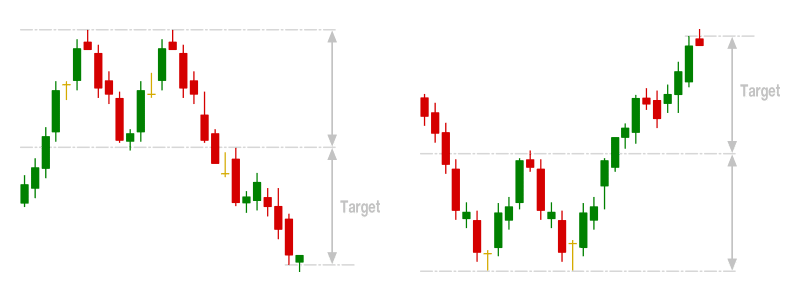
Similarly, triple tops and triple bottoms form after the price makes three peaks or valleys after a strong trending move. They also signal fading momentum of the dominant trend and a desire for the market to change course. The height of the formation also serves as the price target for a reversal when the neckline is breached.
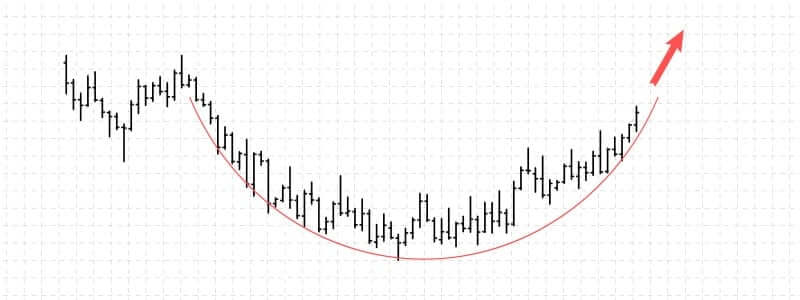
A rounding bottom is a bullish reversal pattern that forms during an extended downtrend, signalling that a change in the long-term trend is due. The pattern is nicknamed ‘saucer’ because of the clear ‘U’ visual shape that it forms. The formation of the pattern implies that downward momentum is declining, and sellers are gradually losing the battle to buyers. A rounding bottom forms when the pace of falling prices decreases, followed by a brief period of price stabilisation that forms a rounded low (not a sharp ‘V’ shaped low). Prices then begin to advance from the low point so as to complete the right half of the pattern, a process that takes roughly the same time it took the initial left half of the pattern to form. A bullish reversal is confirmed if prices break above the neckline of the pattern. Traders will look to place buy orders after the breakout, with the profit target being the size of the actual pattern (the distance between the neckline and the low of the pattern). It is important to note that reversal chart patterns require patience as they usually take a long time to play out. This is mainly because it requires a strong conviction before investors can fully back up the opposite trend.
The Diamond Pattern is a rare yet powerful reversal pattern that often appears at the top or bottom of a strong trend. While it is not as commonly discussed as the head and shoulders or triangles, professional traders recognise its potential for identifying major market reversals.

The pattern takes shape as price movement expands and then contracts, forming a structure that resembles a diamond. It typically consists of:
Many retail traders focus on common patterns like flags and triangles, missing out on the diamond pattern’s potential.
It requires patience to spot, and because it appears less frequently, it is often ignored in favour of more common setups.
The Quasimodo Pattern, also known as the Overextended Head and Shoulders, is an advanced price action pattern widely used by institutional traders.
Unlike traditional chart patterns, Quasimodo focuses on liquidity and smart money concepts, making it a powerful tool for high-probability trade setups.

The pattern consists of:
Institutional traders use this pattern to manipulate retail traders who enter on breakout signals. The false breakout creates liquidity, which smart money uses to enter positions in the opposite direction.
Patience is Key: Since Quasimodo is a high-probability setup, waiting for the right confirmation is crucial.
Neutral chart patterns occur in both trending and ranging markets, and they do not give any directional cue. Neutral chart patterns signal that a big move is about to happen in the market and traders should expect a price breakout in either direction.
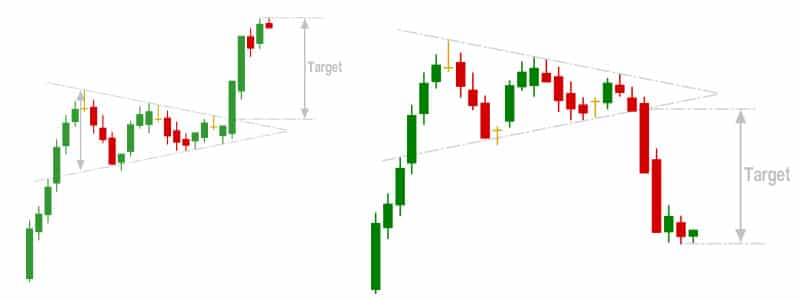
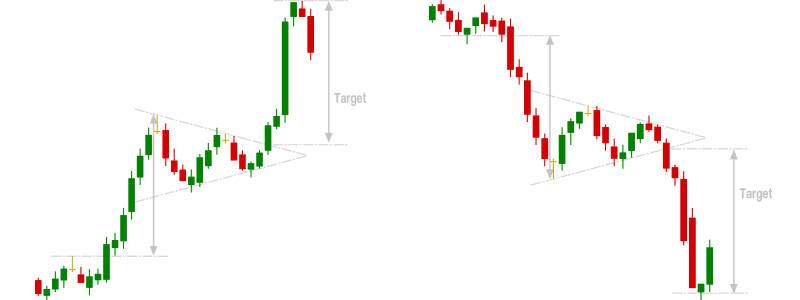
Symmetrical triangles are some of the most common neutral chart patterns. A symmetrical chart pattern forms when the price forms lower highs and higher lows. The slopes of the highs, as well as that of the lows, converge to form a triangle. The formation illustrates that neither bulls nor bears are able to apply enough pressure to form a definitive trend. No group has an upper hand, and as the price converges, one of them may have to give in. With prices converging, buyers and sellers are pitted against each other. If buyers win, prices will break out upwards; if sellers win, prices will break out downwards. Traders watch neutral chart patterns without directional bias and seek to join the momentum of the new trend
Chart patterns are a graphical representation of the real-time demand and supply in the market. Chart patterns allow traders to enhance their trading activity by enabling the following:
Despite the benefits of forex chart patterns, they are not without their disadvantages (just like any other investing or trading strategy). Here are some of the disadvantages:
Chart patterns offer an efficient way of tracking price action in the market, to identify lucrative trading opportunities. Here are some tips for making the most out of trading forex chart patterns:
While individual chart patterns provide valuable trade signals, their reliability significantly improves when analysed across multiple timeframes.
Multi-Timeframe Analysis (MTA) is a powerful technique that helps traders filter out false signals and align trades with the broader market trend.
A common approach is the Three-Timeframe Rule:
Not all chart patterns play out as expected. While technical analysis provides a structured approach to trading, market conditions, volume dynamics, and false breakouts can lead to pattern failures.
Understanding these failure scenarios can help traders to mitigate risks and even capitalise on reversals when patterns do not work as anticipated.
A false breakout occurs when the price moves beyond a pattern’s expected breakout level, only to reverse direction shortly after.
This often happens due to liquidity grabs where institutional traders push the price to trigger retail stop-loss orders before driving it in the opposite direction.
Volume plays a crucial role in validating chart patterns. Without sufficient volume, even the most well-formed pattern can struggle to follow through as expected.
The effectiveness of chart patterns varies depending on market volatility and trend strength.
Chart patterns provide a reliable way of tracking price changes in the market. They help traders identify prevailing market conditions (existing trends as well as key support and resistance levels).
Chart patterns also help in anticipating possible changes in market conditions and provide an objective way of taking advantage of arising trade opportunities. While they provide compelling trade signals, it is important to exercise strict risk management when trading chart patterns because they are not 100% reliable.
Thus, chart pattern trading signals should be traded with definitive price targets and stop-loss orders at all times to limit risk exposure and enhance profit opportunities. It is also prudent to combine chart patterns with other analysis techniques, such as technical indicators and candlestick patterns, to qualify the generated trading signals. This will help alleviate the disadvantages of chart patterns, such as false signals and subjectivity bias.
Overall, the advantages of chart patterns far outweigh their disadvantages. Since there are numerous forex chart patterns that can form in the market, traders should seek to build and improve upon their trading knowledge and skills so that they can accurately identify and fully exploit the trading opportunities delivered by chart patterns.
If well understood, chart patterns have the potential of generating a steady stream of lucrative trading opportunities in any market, at any given time. At AvaTrade, you can use a demo account in order to learn how to recognise chart patterns, without putting any of your trading capital at risk.
If you’re going to trade forex patterns the first step is to not only learn what each pattern looks like and how it forms, but to memorize the patterns and learn to recognize them as they are being created on the charts. Once you have that mastered it becomes far easier to trade forex patterns. As you identify a pattern developing you highlight the proper buy point and if the price of the currency pair hits that point you enter your position. You should also have a profit target where you exit the position to collect profits.
Learning how to analyze a forex chart is a critical skill for anyone interested in trading forex markets successfully. The process of analyzing the chart begins with choosing the proper time frame. If you want to day trade you’ll choose a shorter time frame, perhaps one hour or less, but for momentum trades a longer time frame such as daily works best. You can also analyze the weekly chart to get a long-term picture of the market. Once you have the proper time frame your analysis is a matter of looking for emerging trends and technical patterns, as well as support and resistance levels.
Trading patterns act as a visual representation of past market activity and as indicators of future price movement. Identifying these trading patterns can be quite frustrating for the novice trader, but once they internalize the patterns and get experience in identifying them it becomes far easier. Once it becomes second nature identifying trading patterns becomes a powerful tool. It’s important to realize too that not every pattern plays out as expected. Having an exit plan when a pattern goes wrong is just as important as identifying the trading pattern in the first place.
** Disclaimer – While due research has been undertaken to compile the above content, it remains an informational and educational piece only. None of the content provided constitutes any form of investment advice.
Technical Analysis Indicators & Strategies • 7 min

Technical Analysis Indicators & Strategies • 8 min

Technical Analysis Indicators & Strategies • 7 min

Technical Analysis Indicators & Strategies • 6 min

Technical Analysis Indicators & Strategies • 6 min

Technical Analysis Indicators & Strategies • 7 min

Technical Analysis Indicators & Strategies • 8 min

Technical Analysis Indicators & Strategies • 8 min

Technical Analysis Indicators & Strategies • 6 min

Technical Analysis Indicators & Strategies • 15 min

Technical Analysis Indicators & Strategies • 8 min

Technical Analysis Indicators & Strategies • 6 min

Technical Analysis Indicators & Strategies • 6 min

Technical Analysis Indicators & Strategies • 6 min

Technical Analysis Indicators & Strategies • 12 min

Technical Analysis Indicators & Strategies • 7 min

Technical Analysis Indicators & Strategies • 6 min

Technical Analysis Indicators & Strategies • 18 min

Technical Analysis Indicators & Strategies • 10 min

Technical Analysis Indicators & Strategies • 17 min