
ROC Trading Strategies
The Rate of Change (ROC) is a price-based indicator designed to measure the rate at which the price changes, similar to Momentum Indicator. ⭐ Learn more >>>
Intermediate • 7 min
The percentage of our retail client accounts that were profitable in the last, most recent, four quarters was: | Q2-2026 : 29% | Q1-2025: 31% | Q4-2025: 29% | Q3-2025: 40%. Contracts for Difference (CFDs) are complex instruments with a high risk of losing money rapidly due to leverage and may not be suitable for all investors. You should not trade with money you cannot afford to lose. These percentages are for illustrative purposes only and do not indicate future performance.
Trading strategies that will help you to pick out and exploit the best opportunities.
The Rate of Change (ROC) is a price-based indicator designed to measure the rate at which the price changes, similar to Momentum Indicator. ⭐ Learn more >>>
Intermediate • 7 min
Stochastics indicator is one of the most powerful and commonly used technical analysis tools. ⭐ Read our in-depth guide to learn how to use it for trading.
Beginner • 8 min

Bollinger Bands are a technical analysis indicator that is used by traders to estimate the price volatility of a specific financial instrument. Learn more >
Beginner • 7 min
Ichimoku Cloud helps traders to pick out trading opportunities in trending markets, establish price momentum, and plot support and resistance price zones.
Intermediate • 6 min
Parabolic SAR (parabolic stop and reverse) is one of the most popular trend-following indicators. Read our guide on how to use it for trading here >>>
Intermediate • 6 min

The Aroon indicators are a type of momentum oscillator that was developed in 1995 by Tushar Chande. Learn how to start trading @ Friedberg Direct
Intermediate • 7 min

Average Directional Movement Index (ADX) is a technical analysis tool used by traders to establish trend strength as well as trend direction. Learn more >
Intermediate • 8 min
Donchian Channel is a volatility indicator that helps to identify and define price trends & determine the optimal entry and exit points in ranging markets.
Intermediate • 8 min

TRIX is a powerful indicator designed to help traders determine the momentum of a price and identify overbought and oversold conditions. Learn more here >
Intermediate • 6 min

Bill Williams has developed his own proprietary indicators that are now extremely popular and available on most trading platforms. ⭐ Learn more >>>
Intermediate • 15 min

How to install the Commodity Channel Index on MT4 & how to interpret its signals. Read about more complex trading strategies based on CCI and start trading.
Beginner • 8 min
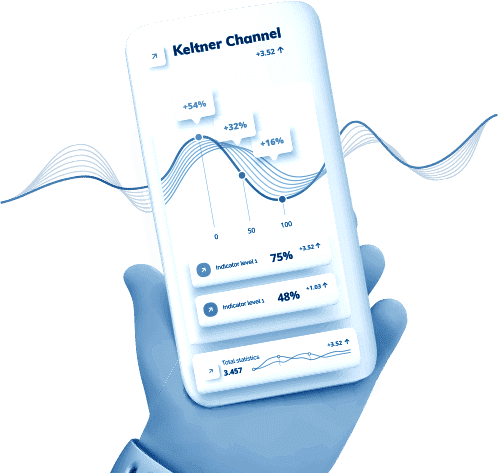
The Keltner Channel is a volatility-based indicator that helps in defining trends as well as pinpointing overbought and oversold conditions in the market.
Intermediate • 6 min

The Money Flow Index (MFI) is a technical analysis indicator that allows traders to ‘follow the money’. Read our guide on how to use it for trading here>>>
Intermediate • 6 min

The Relative Vigour Index (RVI) is a technical analysis indicator designed to measure the conviction of the recent trend of an asset. Learn to use it here >
Intermediate • 6 min
Awesome Oscillator is an amazing technical analysis indicator designed to measure the market momentum as well as to confirm trends and anticipate reversals.
Intermediate • 12 min

Elliott Waves describe how the collective psychology & sentiment of market participants drive the demand & supply of underlying assets. ⭐ Learn more >>>
Intermediate • 7 min

Pivot Points are used to map out support and resistance zones. Learn how to use this indicator for trading Forex and CFDs. Try it on a free demo account >>>
Intermediate • 6 min

The Average True Range (ATR) is a common technical analysis indicator designed to measure volatility. ⭐ Read more to learn how to use it for trading >>
Intermediate • 18 min

MT4 indicators are analytic tools that help traders to do efficient technical analysis of the assets' prices. ⭐ Learn their features.
Beginner • 10 min

Technical analysis tools fall into two broad categories: leading and lagging indicators. Visit the Friedberg Direct education section and learn more. Click here!
Intermediate • 17 min

Samurai class rice merchants these oblong coloured balloons offer a wealth of information ⭐ often sufficient in themselves to predict boon or crash...
Beginner • 4:17 min

Money goes around in circles ✅ some have it, some need it; and based on the circular nature of supply & demand, currency prices orbit.
Beginner • 3:05 min

Prices move in patterns. Study the pattern and what’s behind it, and you’re half way there...➤ Video Tutorial for beginners.
Beginner • 3:10 min

once you see the Trend Lines, all that’s left is to decide if you intend to follow it or wait for its reversal ⭐ Video for beginners.
Beginner • 6:56 min

The battle between technicians & fundamentalists is oft worthy of a soap operatic epic saga. How important are the motivating forces?
Beginner • 1:59 min

How one Italian mathematician in the Middle Ages saw a pattern in snail shells & earned his place in financial history???
Beginner • 5:12 min

Contrary to its name, the Moving Average Convergence Divergence Indicator is not really that hard to master ⭐ Learn how..
Beginner • 6:16 min

Just below the chart lies the oscillator, & this one can tell us if an asset is overbought or oversold – an excellent piece of information.
Beginner • 7:58 min

Complex candlestick patterns contain so much information, it’s hard to imagine it all exists on a 2-dimensional readout ⭐⭐ Video Tutorial ⭐⭐
Beginner • 5:16 min
The simplest candlesticks tell us how much action there has been, in what direction, and if a trend is about to change.
Beginner • 7:29 min

By cancelling out the noise, Moving Averages reveal the trend, but there’s a lot to be learned when we combine different timeframes.
Beginner • 6:16 min

Why does technical analysis work? Is it because markets are created by individuals – each with his/her own fears and lusts?
Beginner • 8:02 min

Where physics & finance come together is in the simple notion that the higher an object’s momentum, the more force is required to sway it.
Intermediate • 3:13 min

The basic strategy in the market is to buy an asset when prices are at the support level and to sell when prices are at the resistance level.
Beginner • 12 min

Chart patterns are powerful technical analysis tools because they represent raw price action & help traders to feel the mood and sentiment of the market.
Beginner • 27 min

Read our comprehensive guide to candlestick patterns to learn how they are formed, which trading signals these patterns provide, and how to trade on them.
Beginner • 11 min

RSI (Relative Strength Index) is one of the main oscillators used in technical analysis, and it's used in various trading strategies. Click to learn more!
Beginner • 13 min

What are Fibonacci levels? Learn about the technical analysis indicators based on Fibonacci sequence. Fibonacci trading strategy examples included!
Beginner • 9 min

Read how to install and use MACD in online trading strategies. Types of MACD indicator settings, parameters and signals. Learn to use technical analysis!
Beginner • 11 min

Install and use Moving Averages Indicator in online trading. Types of MA indicator settings, parameters and signals. Learn to use technical analysis!
Beginner • 13 min
Online CFD trading is a fast and dynamic financial market. To ensure you can earn profits in such a market, investors must have tried and tested CFD and forex trading strategies that will help them to pick out and exploit the best opportunities at any given time. At Friedberg Direct, we are committed to ensuring that traders get access to comprehensive educational materials that not only help one to develop a personal trading strategy but also to learn and use tried, tested and proven technical strategies in the financial market.
Trading strategies are not one-size-fits-all; different traders are comfortable with different strategies within different market conditions. It is therefore important to determine the type of trader that you are (short term or long term) as this will determine the timeframe chart that you will focus on. CFD and forex traders mostly utilise technical analysis methods in analysing the price changes of their preferred assets.
This requires the understanding of price action methods (candlestick types and candlestick patterns) as well as the different categories of technical analysis indicators that help measure price elements such as momentum, trends, volatility, market cycles and volume. When trading online, the most reliable way of avoiding losses and gaining a consistent edge in the market is by being educated. This is why CFD and forex trading strategies require continuous education and relentless practice to fully comprehend their strengths and weaknesses.
Strategies go beyond entry and exit price points. In an inherently uncertain market like this, risk management is an important pillar of any strategy. A solid risk management plan will guide your strategy in terms of the investment amount, the maximum loss per trade, maximum drawdown, and even when it is time to change or tweak the entire strategy.
In the end, the most important element of a strategy is YOU. You must have the discipline and focus to apply your trading strategy in the right manner, in the right market conditions at all times. At Friedberg Direct, we understand this. That is why we offer comprehensive trading education to our clients so that they can gain relevant trading knowledge and techniques that can help them to make knowledge-based decisions in the financial markets. Here are our top technical trading strategies to get you started.
Get deeper into trading concepts and analysis as well as using our trading platforms with our collection of free forex tutorial videos.
Sign up for a demo account and put your learning into action by trading risk-free!